
Autumn 2012
Intelligent design for scientists
Visual Strategies: A Practical Guide to Graphics for Scientists and Engineers
By Felice C. Frankel and Angela H. DePace <br> Design by Sagmeister Inc. with CHIPS <br> Yale University Press, £25, $35
Data is the currency of science. The days of butterflies pinned to a board are largely over: many sciences have moved to a more quantitative mode, spurred on by advances in computing power. The huge amount of raw information being produced by modern scientific experiments is useless without proper interpretation, and visualisations are ways in which signal can be teased from the noise. Yet, though it is crucial to the discipline, and visualisation is at the root of many forms of statistical analysis (arguably the core of biology), scientists are rarely taught how to present their work graphically.
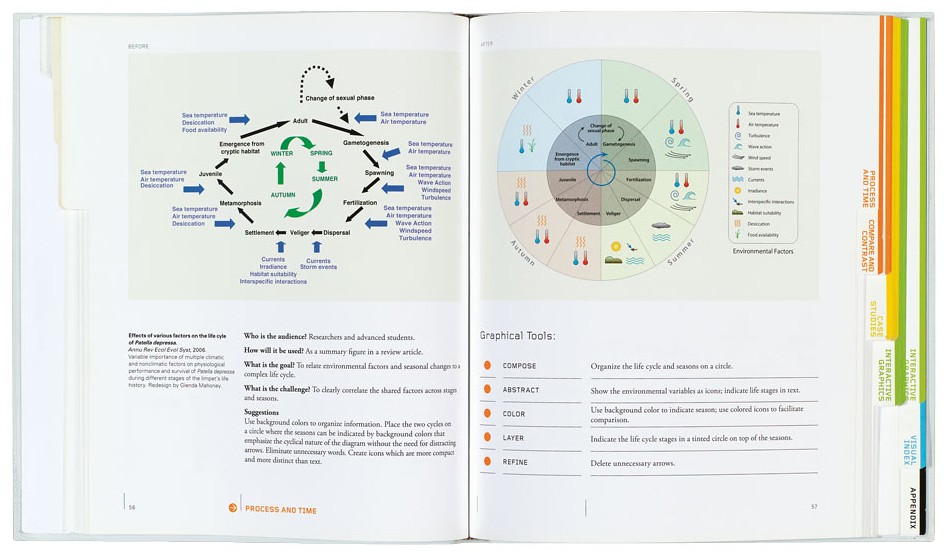
Visual Strategies, far from being a coffee table collection of attractive figures from scientific papers, is a manual of data design. It showcases before and after studies of diagrams and images, redesigned to be more intuitive and parsimonious, condensing the most meaning into the fewest visual elements to allow scientifically versed readers to quickly extract the information they need.
The book was written and conceived by systems biologist Angela DePace and biologist and visual communicator Felice Frankel. Stefan Sagmeister, whose studio led the design of the book, professes in a short interview with the authors that he had little interest in science when he was younger but became fascinated by recent advances in biology while watching recorded TED talks.
Sagmeister notes with surprise the lack of even basic design concepts in some of the figures he reworked for the book (many of them taken from the most esteemed academic journals), and suggests that graphic designers will be embracing with gusto the world of scientific design when they realise how important their services are in making improvements to the standard of scientific discourse.
Best practice in designing scientific figures is not a new concept. Until fairly recently, researchers would liaise with specialist visual communicators to decide how best to put across their work. A number of scientific papers themselves are devoted to the science and psychology of design, and how to present data intuitively: it turns out a rainbow-coloured scale is much less instantly readable than one in shades of grey, for example.
The book’s main sections are marked by coloured tabs, and each one deals with a particular type of representation, be it the three-dimensional shape of a protein (‘Form and structure’), the passage of a limpet through its life cycle (‘Process and time’), the differences between old and diseased brains (‘Compare and contrast’) or a program for exploring a database of analysed images (‘Interactive graphics’). All draw on examples from real-world scientific papers, refining and improving the figures therein and showing which features were changed and why. Attention is paid to where the eye is drawn, how to render data so it is intuitively understood, and the process of liaising with other scientists to ensure the redesigned figure does not imply patterns or trends that are not present.
Top: spread from Visual Strategies showing Glenda Mahoney’s redesign of ‘Effects of various factors on the life cycle of [the limpet] Patella depressa’, 2006.
Henry Stanley, writer and science communicator, London
First published in Eye no. 84 vol. 21 2012
Eye is the world’s most beautiful and collectable graphic design journal, published quarterly for professional designers, students and anyone interested in critical, informed writing about graphic design and visual culture. It is available from all good design bookshops and online at the Eye shop, where you can buy subscriptions, back issues and single copies of the latest issue. You can see what Eye 84 looks like at Eye before You Buy on Vimeo.