
Summer 2012
Relentless information
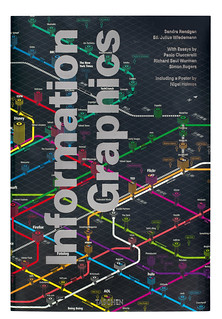
Information Graphics
By Sandra Rendgen and Julius Wiedemann Published by Taschen, £44.99 Designed by Praline

Riding the persistent wave of popular interest in data visualisation, Taschen’s Information Graphics is a shelf-breakingly extensive compendium of the past few years’ infographic explosion. Prefaced by four essays (from Simon Rogers’ rousing paean to data-journalism, to Paolo Ciuccarelli’s rather less cohesive meanderings) the bulk of the book comprises almost 400 oversized pages of relentless graphic overload.
Broadly arranged by Richard Saul Wurman’s LATCH (Location, Alphabet, Time, Category and Hierarchy) method, each example is accompanied by an extended caption outlining what it is showing – a welcome break from context-free ‘look books’, though a more critical, discursive voice would have been appreciated.
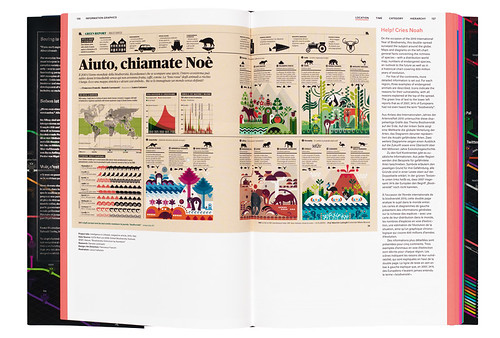
However many of the examples have little to say – which is a problem if they are presented as the peak of their craft. For every National Geographic cutaway or spread from IL (the Italian magazine Intelligence in Lifestyle), there are twenty charts of common words in Faust, or connections between characters in David Foster Wallace’s Infinite Jest.
As Rogers says, our capacity to collect, analyse and distil data into a story is hugely exciting. Sadly, the majority of examples here lack distillation, or any narrative beyond ‘these are the figures’, communicating no better than the raw data but coloured red. When one of the captions includes the phrase ‘instead of actually visualising information’, it is little wonder that the most interesting examples are the historic ones (such as Herbert Bayer’s diagram of the eye, top) that illustrate the opening essays.
IL, the Italian magazine Intelligence in Lifestyle
As a collection of recent trends in infographics, Information Graphics is very thorough – with plenty of examples from editorial, advertising, digital and other fields of design, and the arts sphere – but it covers little ground not already trodden by volumes such as Dataflow. Taschen’s latest addition to this flawed canon is perhaps best seen as an exercise in keeping up to date with – rather than an careful consideration of – modern information graphics.
First published in Eye no. 83 vol. 21 2012
Eye is the world’s most beautiful and collectable graphic design journal, published quarterly for professional designers, students and anyone interested in critical, informed writing about graphic design and visual culture. It is available from all good design bookshops and online at the Eye shop, where you can buy subscriptions, back issues and single copies of the latest issue.