Autumn 2023
The data card trick
Critical Visualization: Rethinking the Representation of Data
By Peter A. Hall and Patricio Dávila, Bloomsbury, £75 (hb), £24.99 (pb)
Data visualisation occurs at the intersection of design and data. It is a practice that grew from statistics, scientific communication, and cartography – three streams that claim to represent the objective truth. If columns and rows of data are truth, then visualising data is making truth visible. Many data visualisation books offer the designer guidance, tools and methods to create the best visual design from the data on hand.
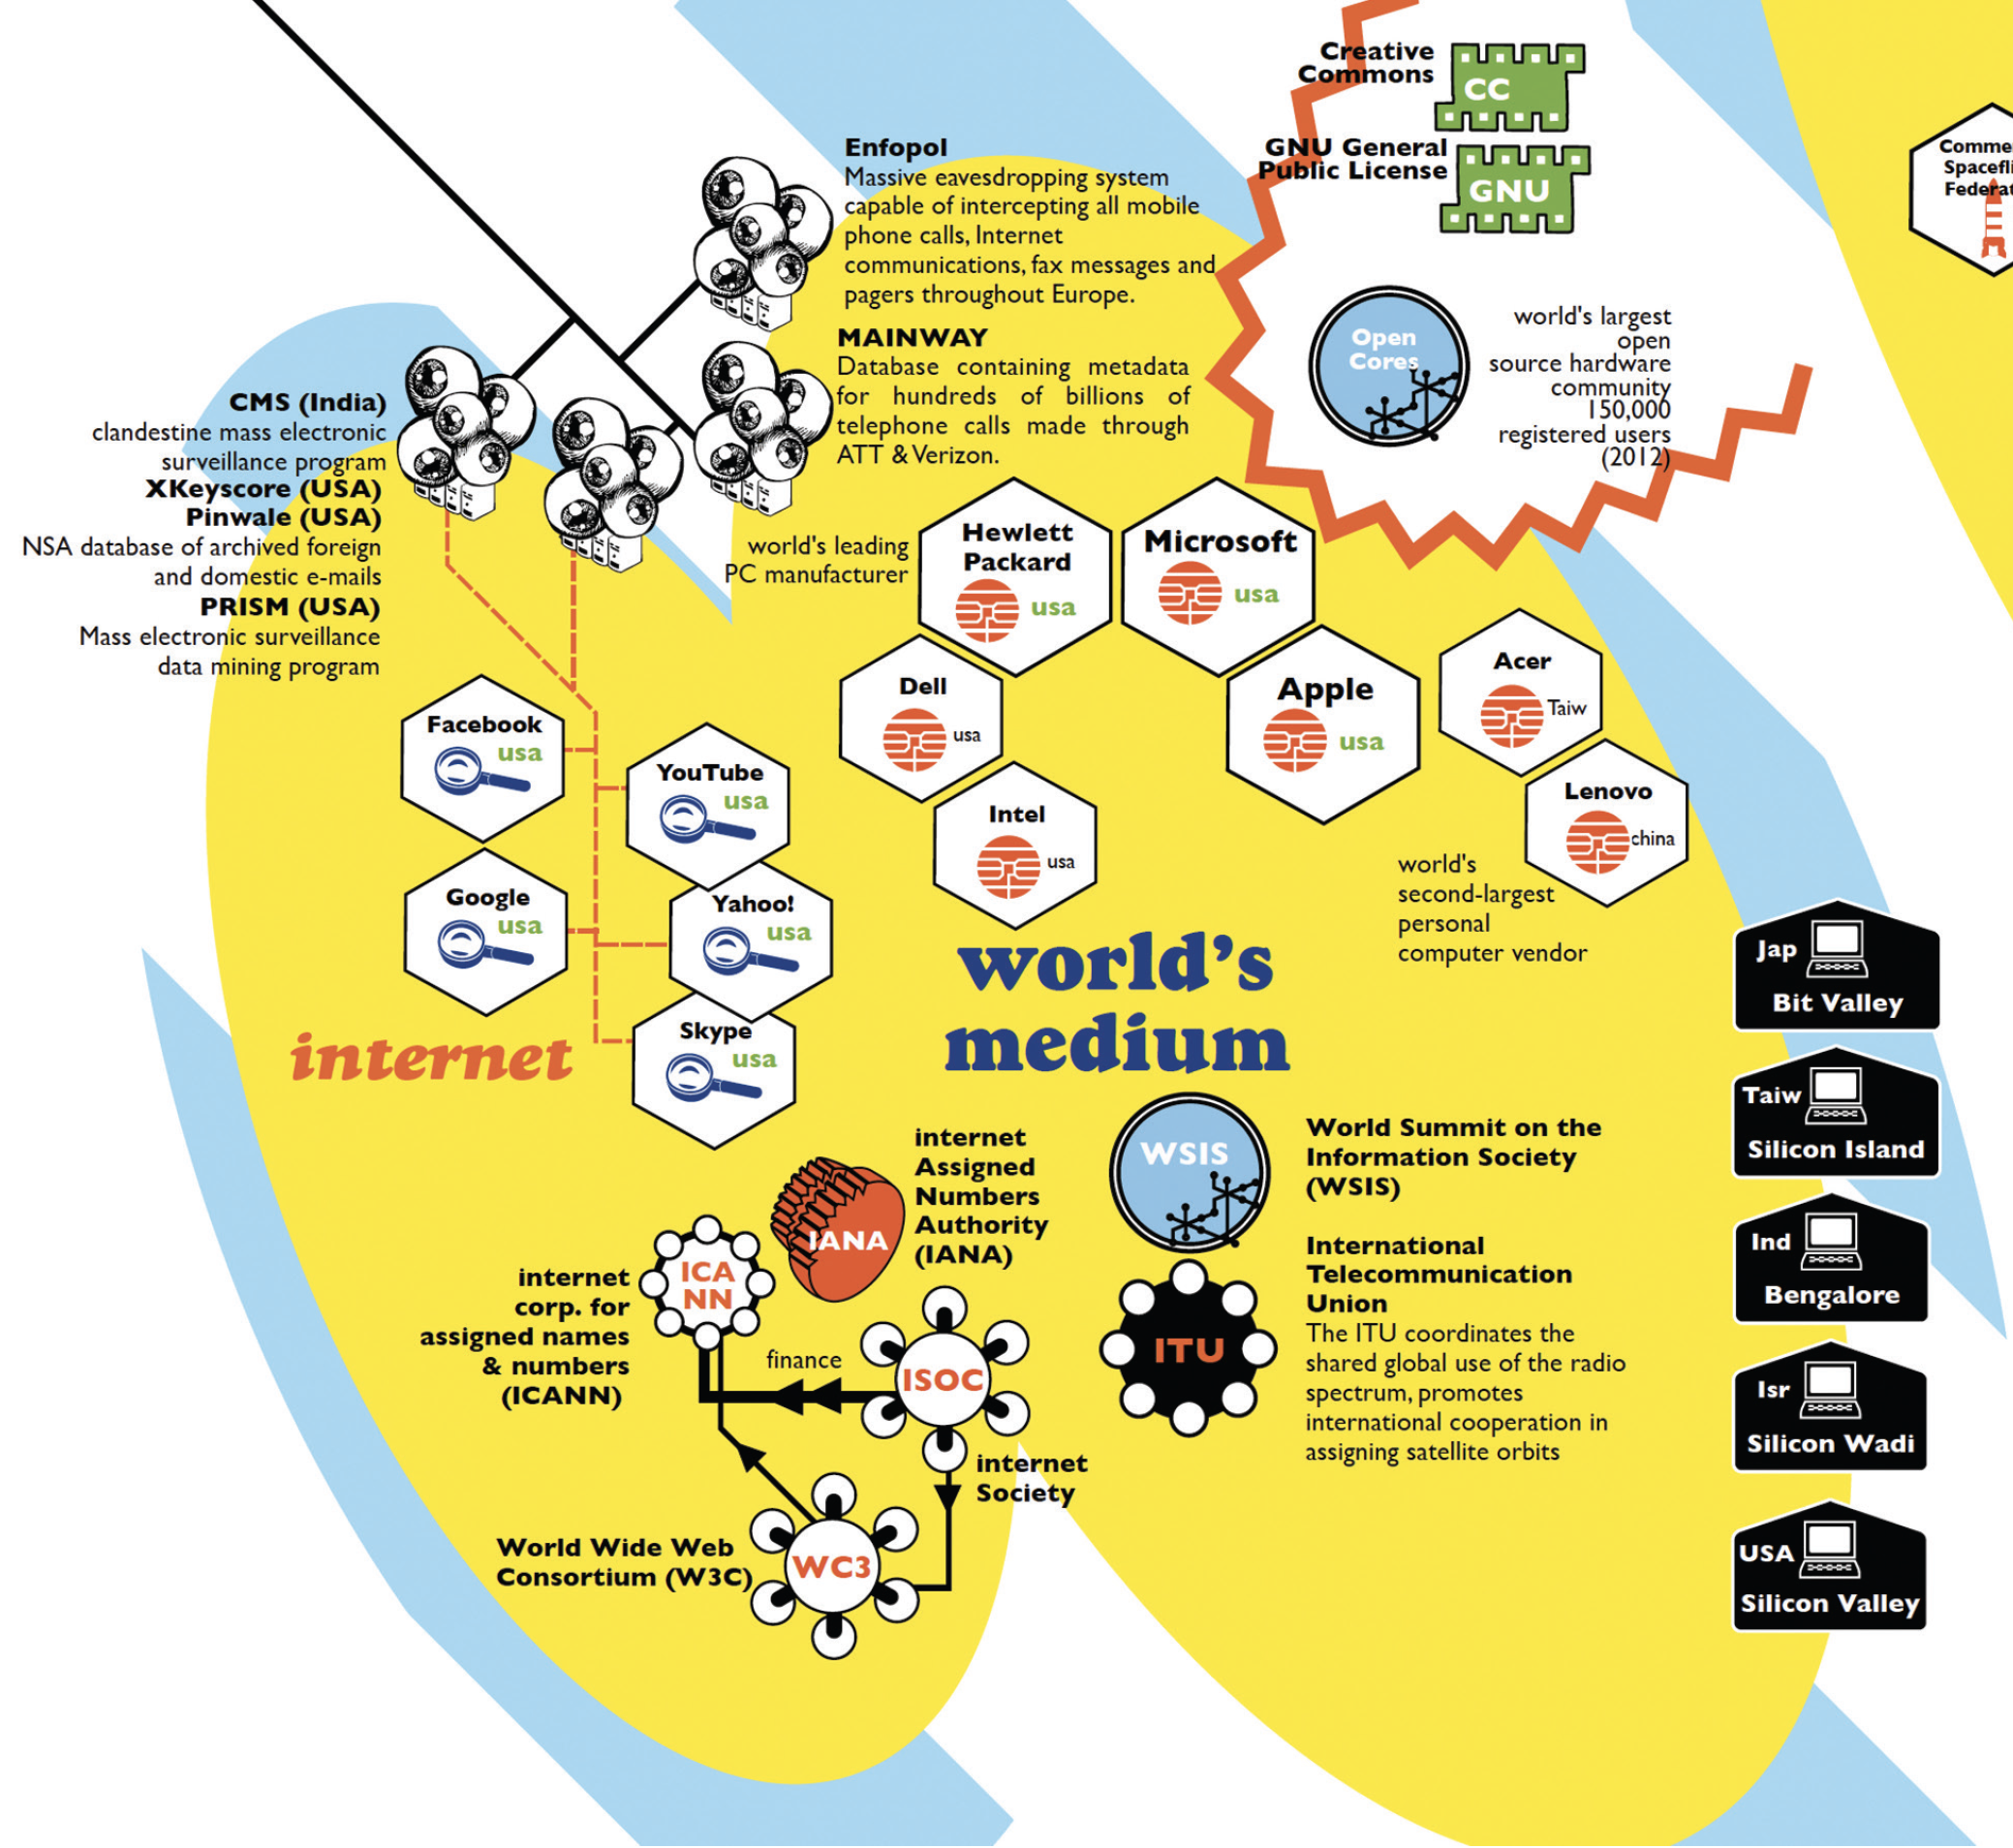
Critical Visualization is less about how to visualise and much more about how to critique the data we consume. It is not another book that starts ‘Today we are drowning in data’ followed by a set of instructions on how to arrange charts into convincing narratives. Instead, the authors start by challenging the objectivity of data. The missing piece of data literacy today, they propose, is the lack of critical thinking about how data are gathered, selected and presented. Designers who ‘affirm the validity of the data and prioritise this data and the reading of this data over other data’ must understand that data is ‘never truly neutral, nor purely objective’. Using Situationist analysis and Actor Network Theory, illustrated by Marc Ngui’s figures, they argue that uncritical visualisation reproduces colonial power structures, marginalises disenfranchised populations, and fails to confront the political distortions of the data being visualised.

To build their critique, the authors apply the same methods that a generation of philosophers have turned on society and technology ‘to show how visualisation both represents and enacts interests’.
Their rethinking is based on a five-point framework: (1) Data visualisations are part of larger data assemblages (2) which enhance and maintain the exercise of power within a society. (3) Data visualisation critique questions these practices, (4) situates visualisations to counter their illusion of objectivity and (5) creates counter-narratives.
They apply this framework to maps, data categories, quantified self, data profiling and smart-city urban planning. To challenge established power structures, critical visualisation subverts the dominant narrative by collaborating with the communities whose data is being visualised. In some cases, the artist subverts existing data by creating their own data set. The authors valorise and reproduce work by Margaret Pearce, a cartographer who has integrated Native American / First Nation voices into narrative maps of North America; Data4Change, a London-based studio that facilitates multi-day design sprints with local social action groups to create data projects; Iconoclasistas, a Buenos Aires-based studio that develops maps and infographics through collaborative workshops; Bureau d’études, a French artist collective that produced a political, social and economic graphic atlas, An Atlas of Agendas (2015); relationship diagrams from The Status Project (2014) by British artist Heath Bunting; and Anna Ridler’s installation Myriad (Tulips), a data set of ten thousand photographs of unique tulips. Each of these examples represents visualisations that, in the authors’ words, ‘subvert the dominant narrative’.
Data visualisation is, at its root, a creative strategy to represent qualities and quantities. The authors remind the reader that an act of representation is a political act. Creating a set of categories or selecting data to visualise hides what it does not reveal. Those of us who serve a client or employer by selecting data and shaping its visual representation are making a series of moral choices. All visualisation is a card trick – like all forms of magic it is about making people see only what we want them to see. The visualisation designer has some ethical responsibility as to how the cards are dealt. In Peter A. Hall and Patricio Dávila’s critique, ‘visualisation performs a paradoxical role of making visible selected aspects of data drawn from our reality, while simultaneously making invisible the way the data was produced. How this dual role of giving voice and silencing is ethically carried out is part of the mandate of a critical visualisation practitioner.’ Now you see it, now you don’t.
Paul Kahn, information designer, lecturer at Northeastern University, Boston, US
Buy ‘Critical Visualization’ at the Eye magazine bookshop
First published in Eye no. 105 vol. 27, 2023
Eye is the world’s most beautiful and collectable graphic design journal, published for professional designers, students and anyone interested in critical, informed writing about graphic design and visual culture. It is available from all good design bookshops and online at the Eye shop, where you can buy subscriptions and single issues.

