Thursday, 12:00pm
14 December 2023
Science visualisation masterclass
Building science graphics
By Jen Christiansen, CRC Press Published by CRC Press / Routledge (AK Peters Visualization series), £38.99Building Science Graphics both recognises and responds to the growing need for scientists and designers to work together, writes Anne Odling-Smee.
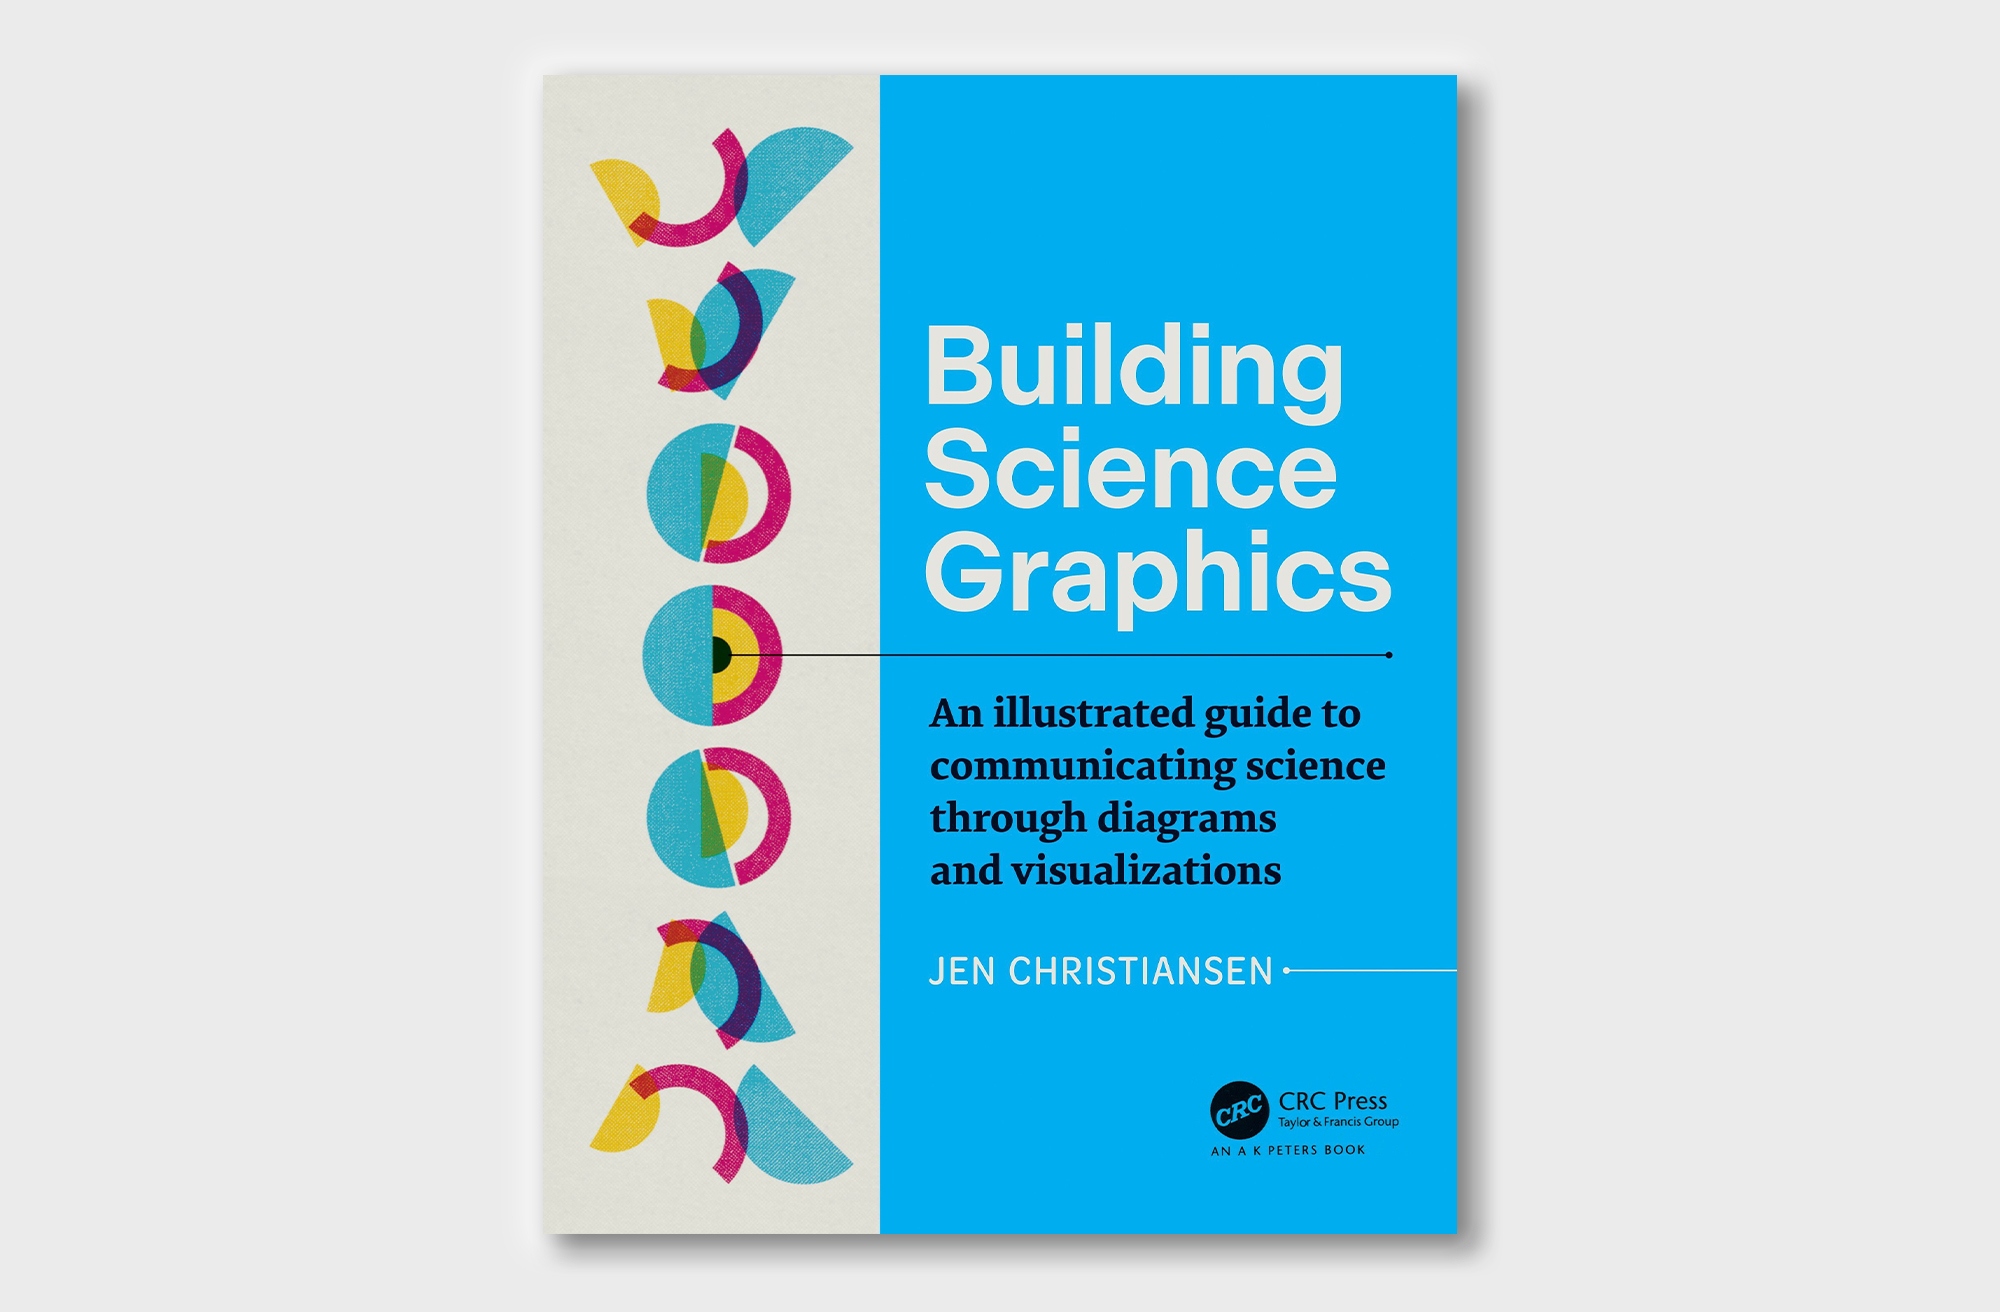
This book both recognises and responds to the growing need for scientists and designers to work together to communicate science effectively, writes Anne Odling-Smee.
Jen Christiansen, senior graphics editor at Scientific American, has written Building Science Graphics as a practical guide ‘for anyone – regardless of previous design experience and preferred drawing tools – interested in creating scientific illustrated explanatory diagrams.’
Christiansen explores the what, the how and the why with a logical rigour. She introduces her manual by describing the concept of information graphics and its role in contemporary science communication, following on with the processes required for creating graphics using evidence-based design strategies. The key ingredients are reassuringly in place, from complexity, uncertainty, participation and storytelling to language and jargon, metaphors, misinformation and – perhaps central to all of these – the understanding of science as process, not just facts.
Meticulously written and intricately designed, the book is accompanied by glowing endorsements from esteemed figures in the communities of both design and science. The President of the Association of Medical Illustrators has hailed it as ‘a masterclass in the field of scientific visualisation’.
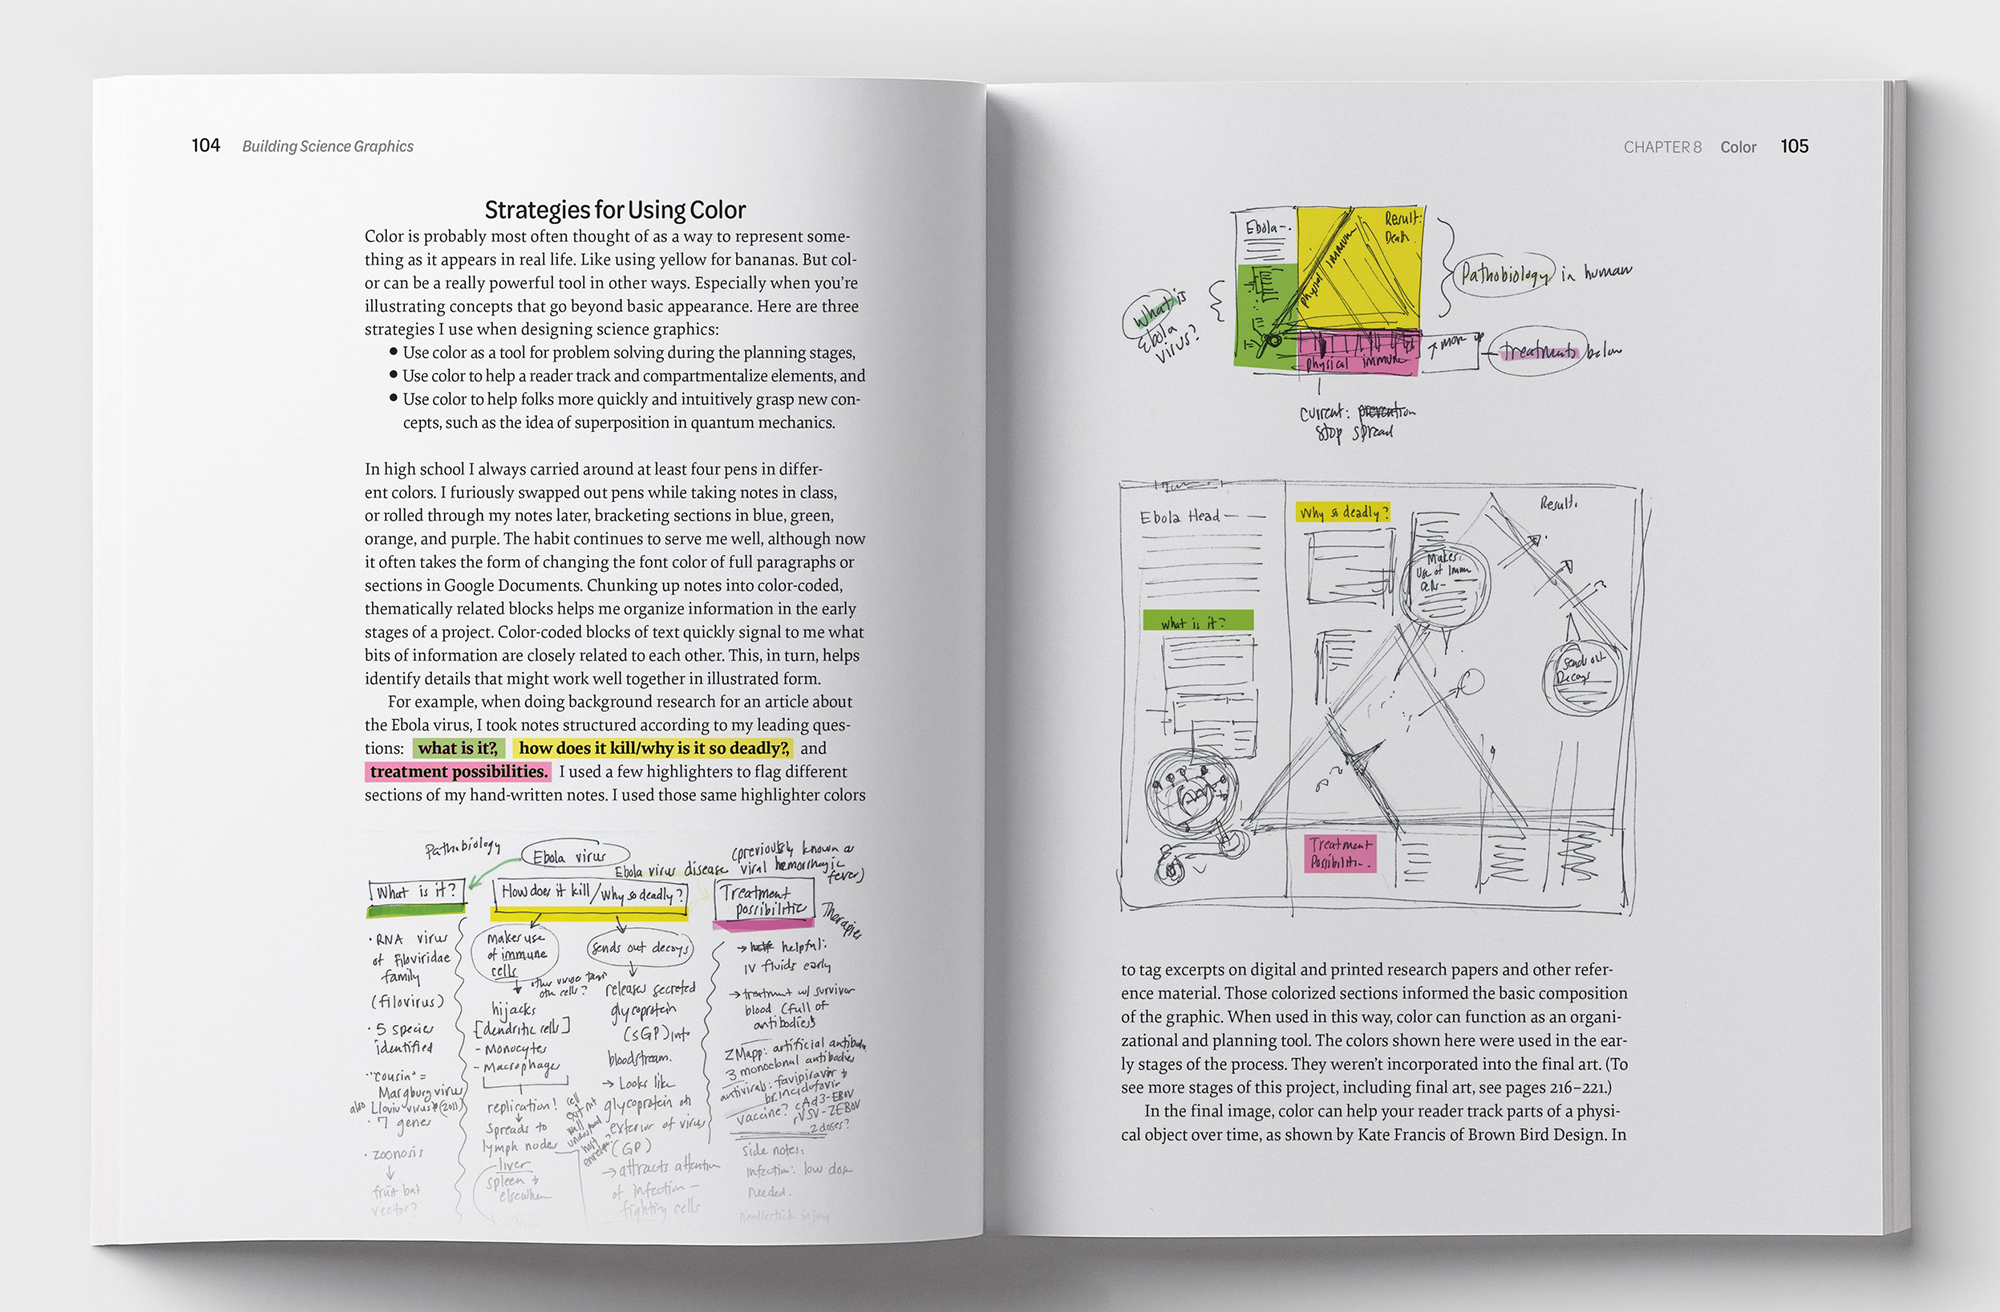
Spread from Building Science Graphics where Jen Christiansen delves into strategies for using colour.
Top image. Book cover featuring an image by Alli Torban.
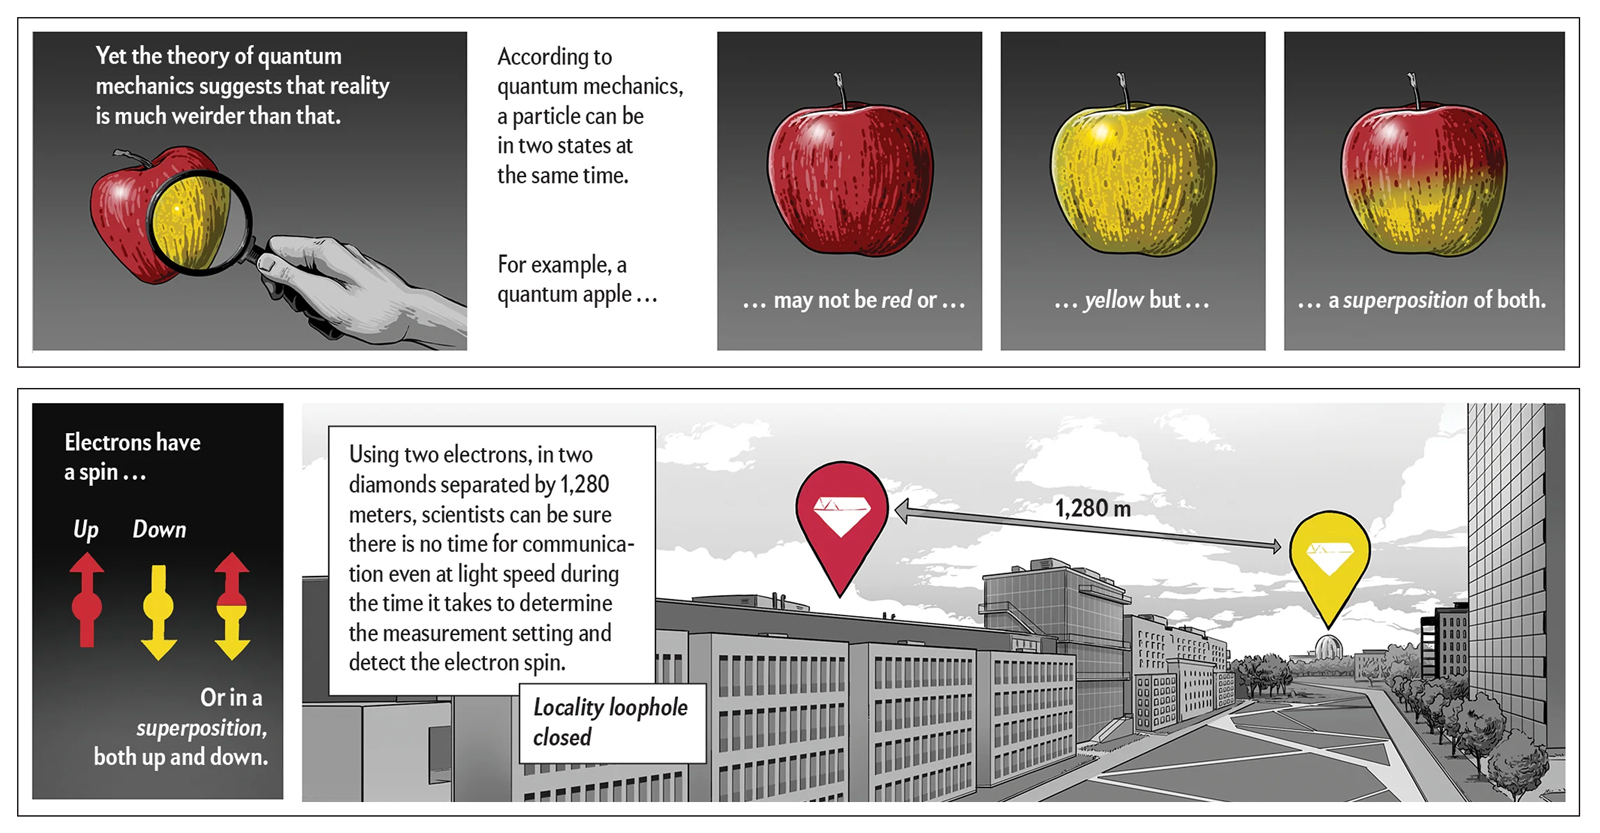
Example of colour used to explain idea of superposition in quantum mechanics, featured in the book. Illustrations by Matthew Twombly.
As a communication designer myself, who has taught design students from various countries, I have long identified a striking parallel: both scientists and designers face a barrier to collaboration stemming from a mutual lack of understanding of each other’s professions. Scientists often lack the knowledge necessary to collaborate with designers effectively. Conversely, designers struggle with essential science communication skills. Christiansen gets this, and her book goes a long way to bridge the divide.
It requires a dedicated commitment to read a hefty 334 pages, even when only delving into specific sections. Faced with today’s global challenges we need a practical guide like this more than ever, but I wonder how many practising scientists or designers will be able to justify the time required to read this book, given their other more pressing responsibilities.
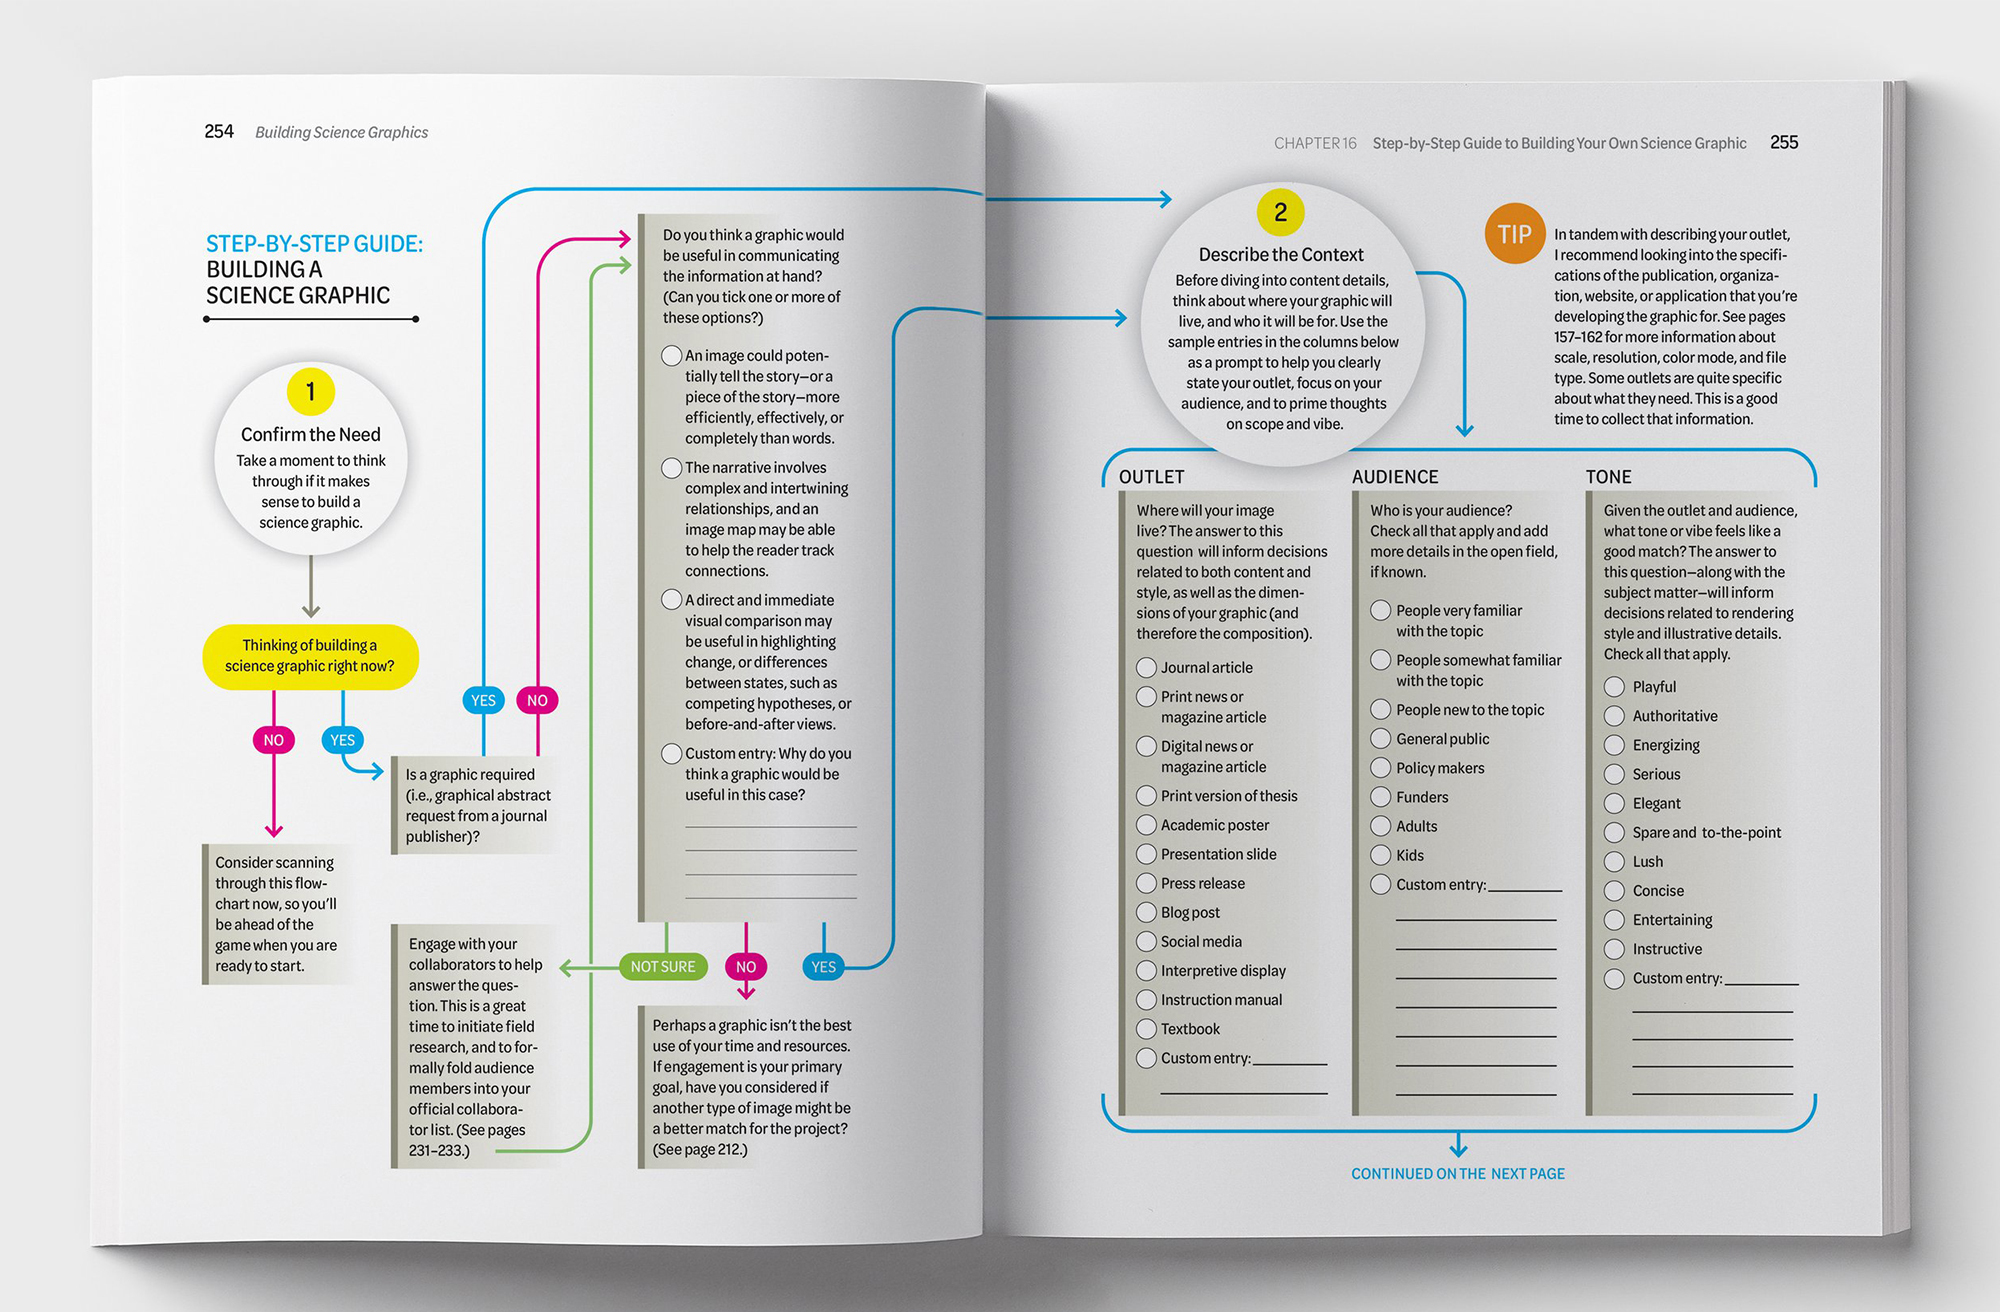
A step-by-step guide to building science graphics, useful for students and infographics beginners alike.
Building Science Graphics will be most valuable in education establishments. It should be on the reading list of every science communication MSc and every communication design BA course. It is rich with references that contemporary graphic designers should be familiar with, including Edward Tufte's seminal The Visual Display of Quantitative Information and the principles of Gestalt theory (describing similarity, continuation, closure, proximity, figure / ground, symmetry and order).
When a designer can tell a scientist that a design decision is backed by scientific research, the scientist’s respect for the designer’s discipline increases tenfold. Scientifically proven legibility studies provide another good topic. If anything, Christiansen could have made more of these research-led overlaps, for example by visualising exactly how Gestalt principles might impact a Nature information graphic.
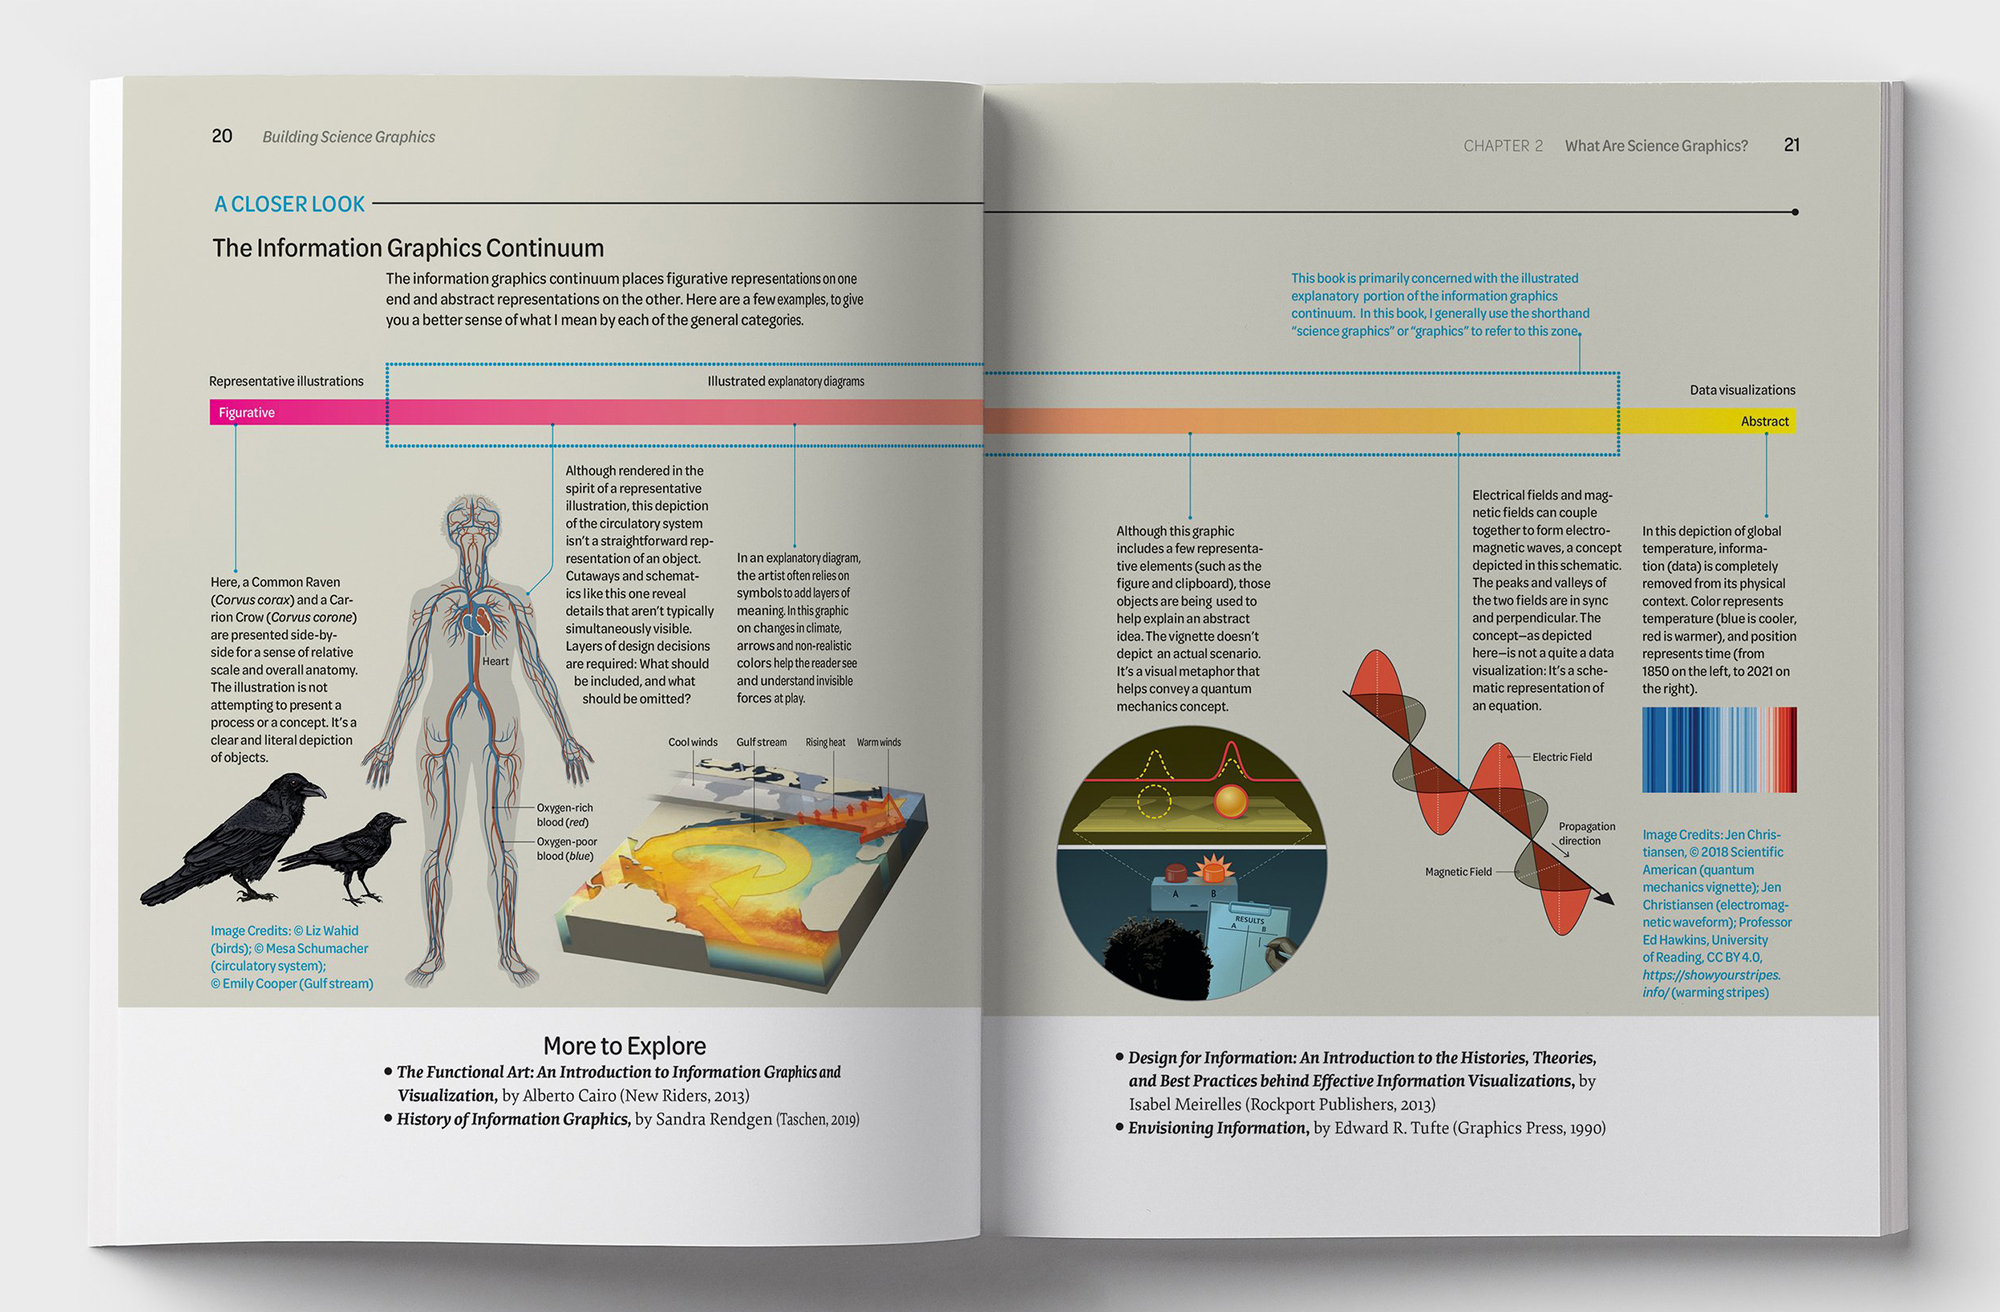
A closer look into the information graphics continuum, with figurative representations at one end and abstractions at the other.
Scientists need designers to help them communicate with other scientists and to ensure that their work has an impact in the real world. The sooner they get better at engaging with graphic designers, and vice versa, the better. So ‘yes’ to more books like this one about communicating science through design, but let us hope that the next one more is widely accessible.
Anne Odling-Smee, designer, writer, director of Design Science
Eye is the world’s most beautiful and collectable graphic design journal, published for professional designers, students and anyone interested in critical, informed writing about graphic design and visual culture. It is available from all good design bookshops and online at the Eye shop, where you can buy subscriptions and single issues.
