Monday, 5:29pm
6 February 2023
Covid visualisations: 2023 update
Paul Kahn reflects upon the way Covid-19 data visualisations and reporting have changed over the past three years
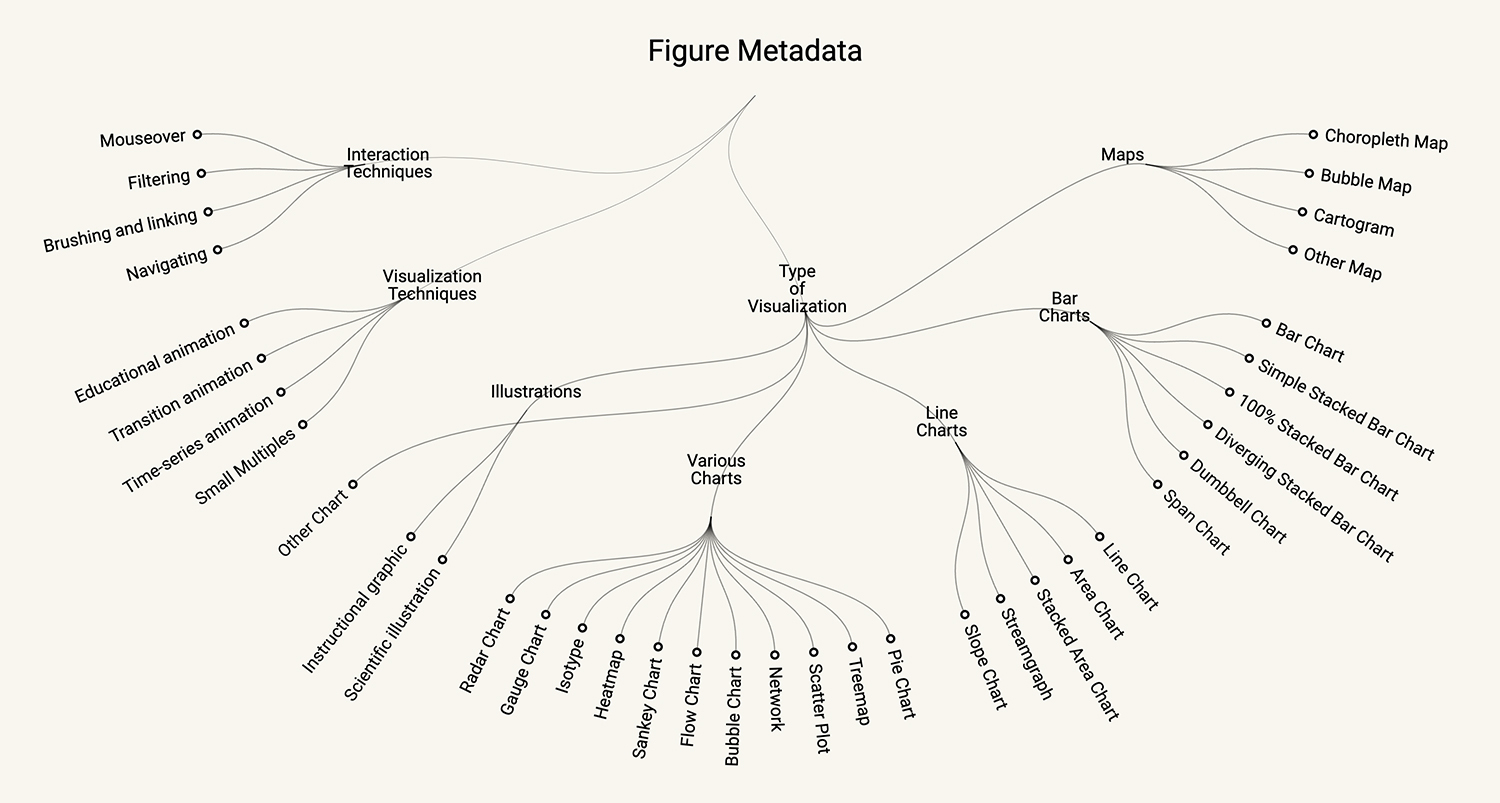
Back in 2021, when ‘The pandemic that launched a thousand visualisations’ was published in Eye 101, we were still seeing hundreds of visualisations per week, and that pace continued into January 2022, writes Paul Kahn. However, the quantity of articles about Covid-19 has decreased in the past twelve months. More notably, the quantity of visualisations in Covid-related news articles has decreased even more dramatically – perhaps one in ten articles that we find today includes a visualisation of any kind.
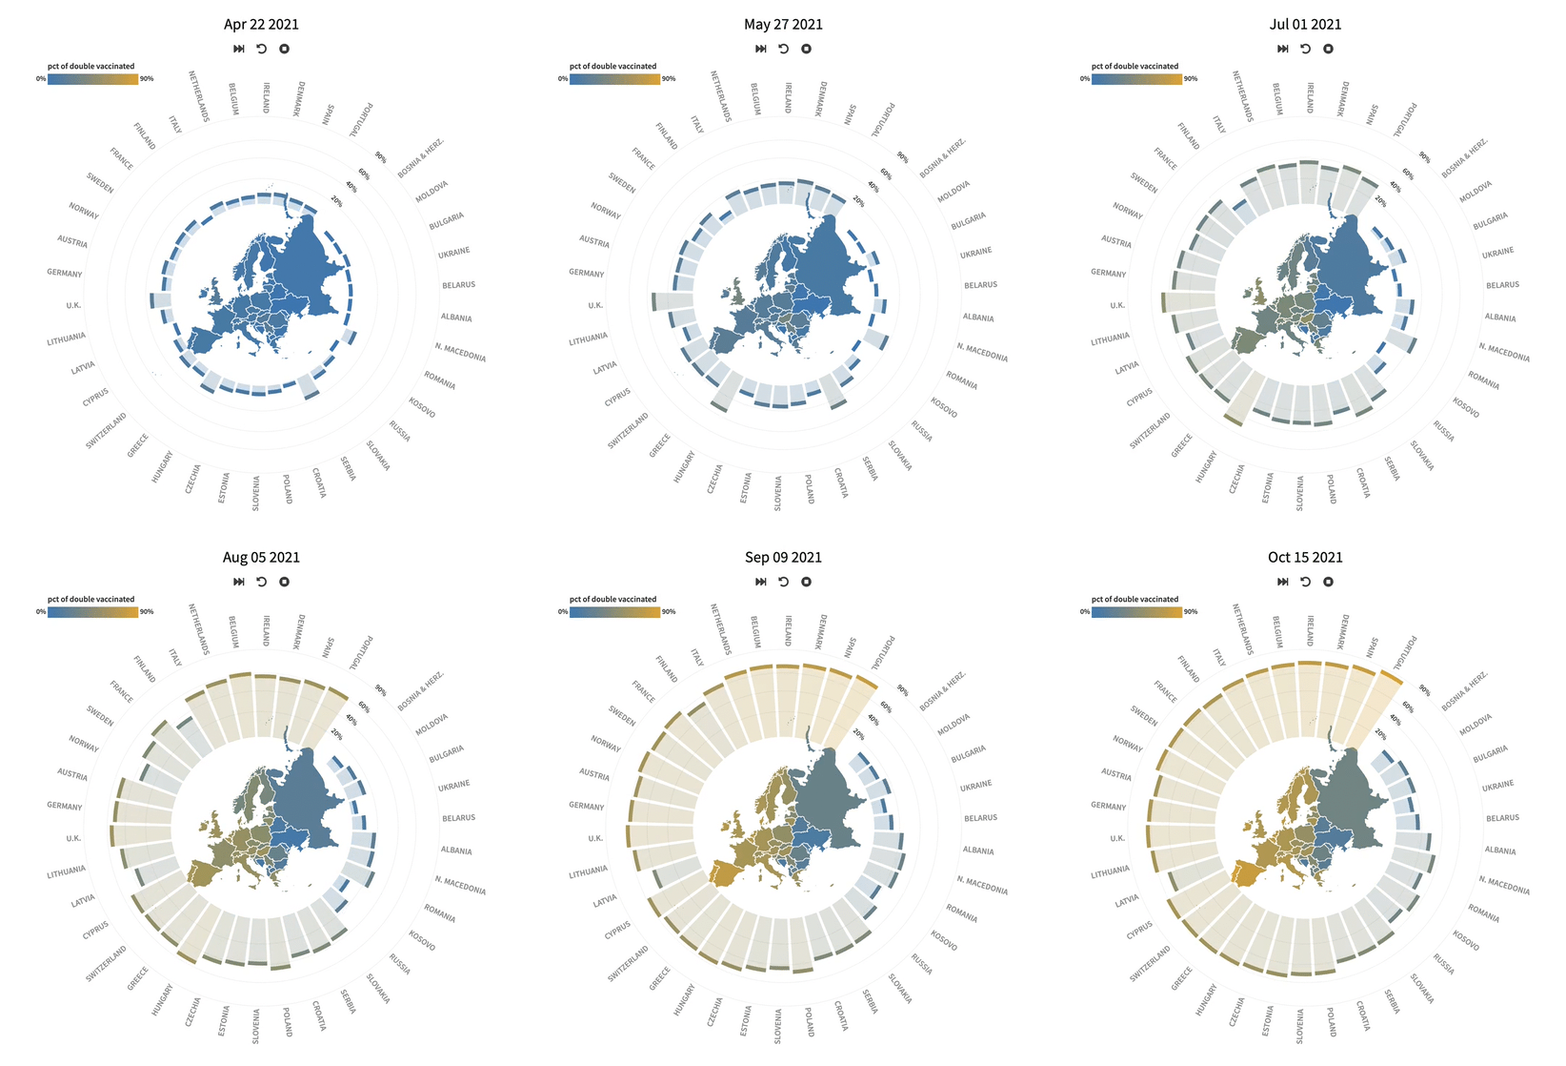
Animated radial of the initial distribution of Covid-19 vaccines in Europe. Reuters, December 2021. Top. Diagram listing types of visualisations, as well as interaction and visualisation techniques gathered on COVIC. Designed and programmed by Liuhuaying Yang.
Transition animation comparing one million Covid-19 deaths to population of different US states. Politico, May 2022.

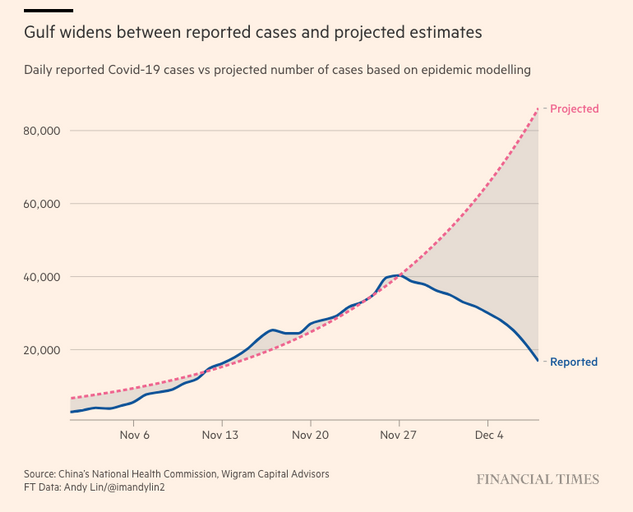
A case in point example is all the coverage of the changing situation in China: lots of text, many photographs, no data, no charts. There are even stories now about the fact that there is no data with, of course, no visualisations.
Line chart showing the discrepancy between projected and reported COVID-19 infections in China by Andy Lin, Financial Times, December 2022.
As new examples have disappeared, we ended the gathering phase of COVIC (the Covid-19 Online Visualization Collection). We now have more than 15,000 examples to review and compare. We hope this resource can foster new understandings of how visualisations can serve our information needs during times of global crisis. Currently we are preparing to work on a ‘lessons learned’ essay, to reflect on our findings.
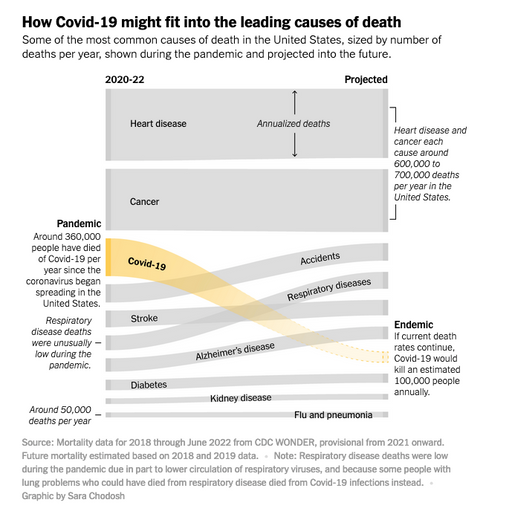
Sankey chart picturing how Covid-19 relates to leading causes of death in the US, designed by Sara Chodosh, New York Times, July 2022.
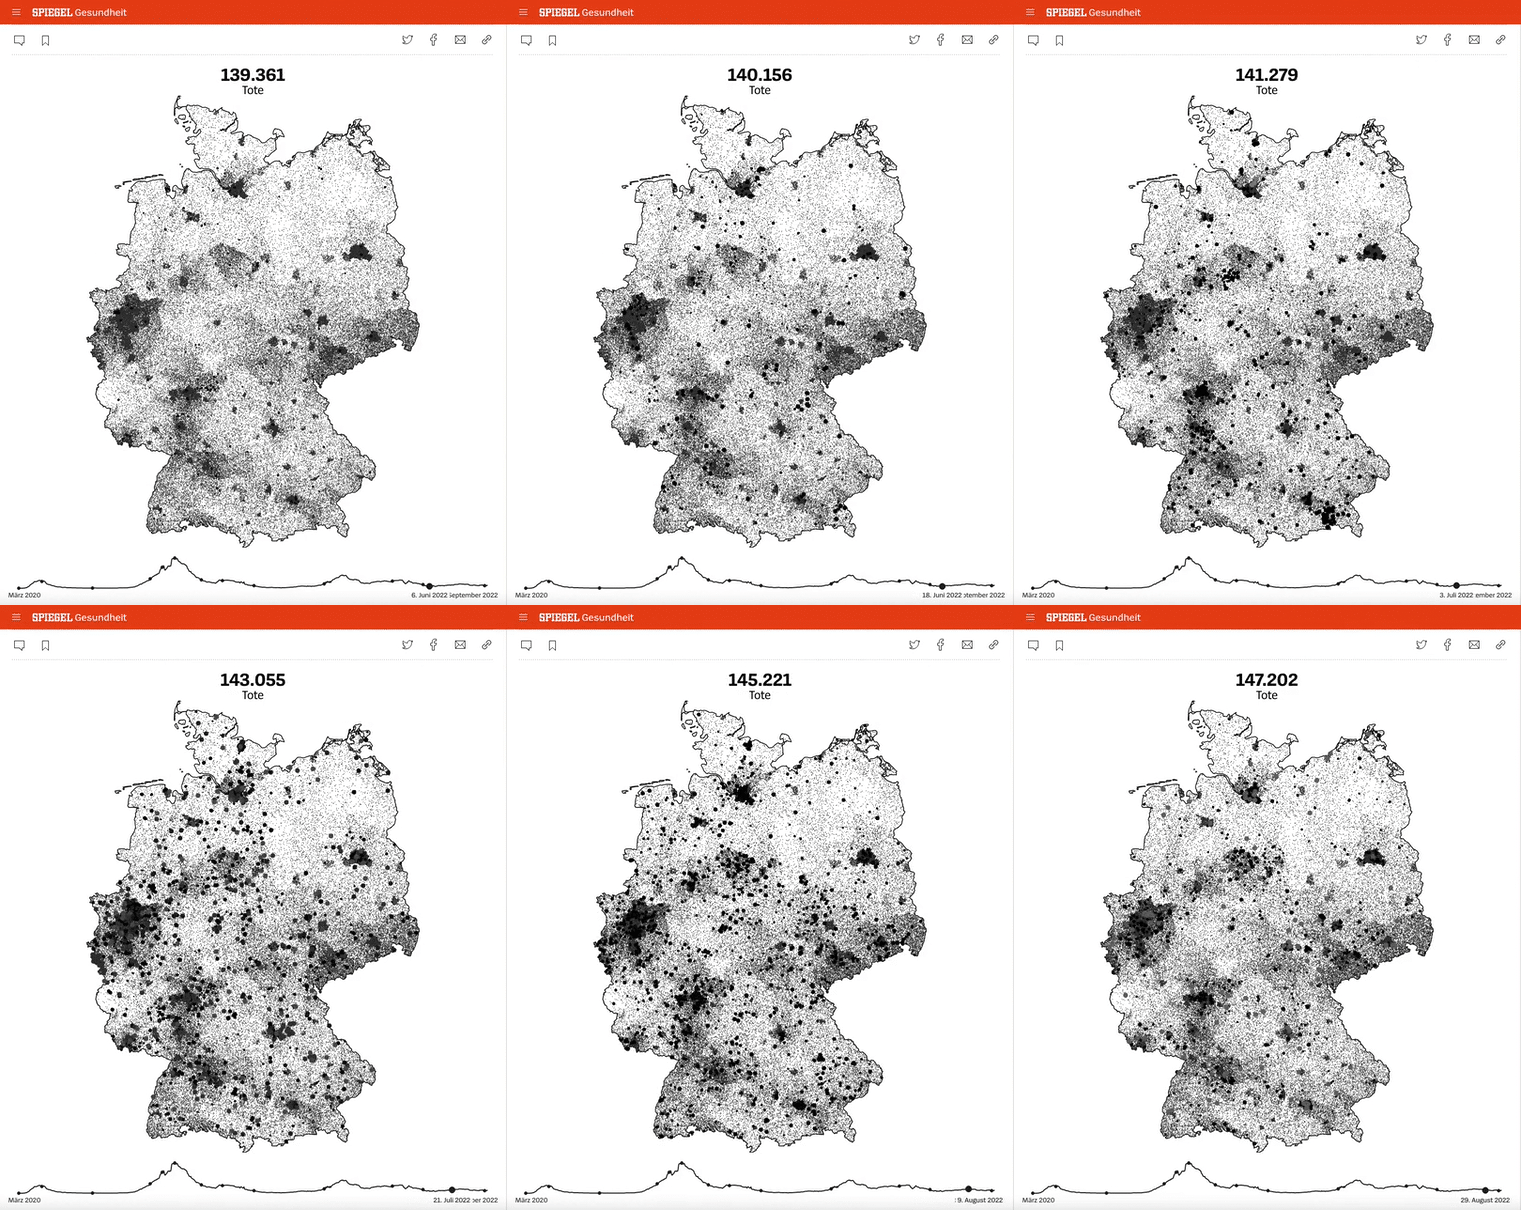
Scrollytelling map animation of Covid-19 related deaths in Germany, Der Spiegel, January 2022.
Paul Kahn, information designer and lecturer at Northeastern University, Boston
More on the topic of Covid-19 data visualisations in:
‘Conversation with John Burn-Murdoch’ by John L. Walters.
‘The pandemic that launched a thousand visualisations’ by Paul Kahn.
‘Visual systems of life and death’ (web-only) by Paul Kahn.
Eye is the world’s most beautiful and collectable graphic design journal, published for professional designers, students and anyone interested in critical, informed writing about graphic design and visual culture. It is available from all good design bookshops and online at the Eye shop, where you can buy subscriptions and single issues.
